
Part of our business is ongoing support with clients who are already live on Netsuite. When you have clients that are regular like that – it’s important to review their account health periodically. The goal is simple: know who’s growing, who’s shrinking, and who we need to call before it becomes a larger problem for us. The data to answer that lives in NetSuite. Getting it out can sometimes come with a little friction.
Logging in, pulling reports, cross-referencing invoiced amounts against collections, building a comparison to the same period last year — all of that isn’t hard, exactly. It simply takes enough time and effort that it doesn’t happen as consistently as it should. We decided to test whether we could make this faster using the NetSuite MCP Connector Suiteapp and Anthropic’s Claude.ai.
What we actually wanted to know
One of the main questions we have to answer in a managed services account review isn’t complicated. For each client: how much did we invoice this period, how does that compare to last year, and how much have we actually collected? Obviously – that’s only part of the picture. But evaluating the health of the people side of the relationship is one step too far for our test scenarios here.
One thing we always want to be aware of when checking for Year over Year revenue is that invoices aren’t revenue — they’re a billing event. A client can have a lot of invoices and still be slow-paying, or shrinking their overall account with us. We wanted invoiced amounts paired with actual cash received, compared year-over-year, to avoid making the mistaken assumption that invoices are all that matters.
What we asked AI to do
We gave Claude a pretty straightforward prompt: pull invoiced amounts by customer for this year to date, and compare it to the same period last year. After that – factor in the actual cash collected against those accounts.
For cash collected we used two transaction types: customer payments and customer deposits. In a professional services context, deposits are typically retainers or project prepayments — real cash in, and worth including alongside payments (although obviously those don’t count as recognized revenue). As per usual – it took Claude just about 30 seconds to run the queries and present the data.
What came back
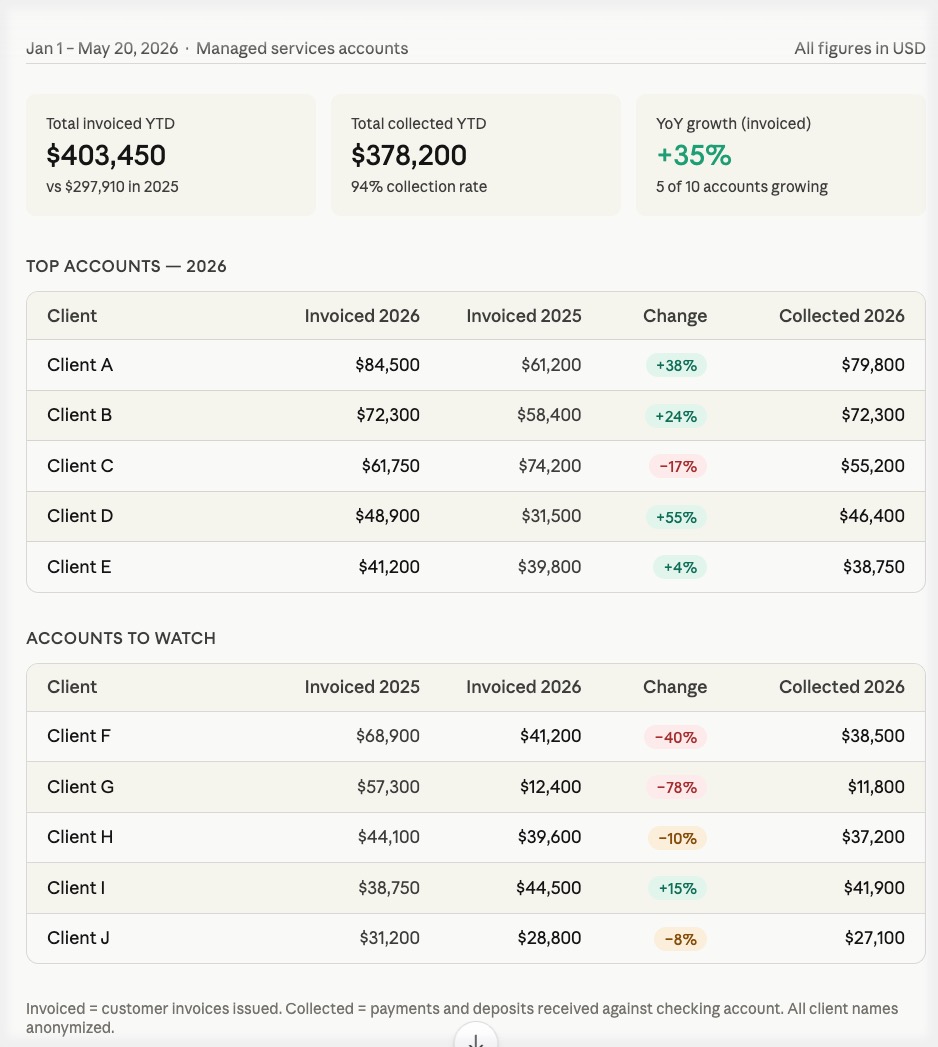
We had two main sections of our report. First there was a section of our top performers. These are the accounts that are growing, paying on time, and represent the healthiest part of the book. The second section is equally interesting, the accounts to watch. These are the ones where invoicing has dropped meaningfully year-over-year, which is your early signal that something has changed in that relationship.
The interesting thing that stood out in these reports were a couple of accounts that looked fine on invoicing actually had a collections gap when you put both numbers side by side. That’s a really helpful insight to have before the gap gets bigger. It’s exactly the kind of thing that falls through the cracks when you’re not looking at both numbers together on a regular basis.
The report also surfaced an account that was down significantly. We aren’t talking about a slow decline – this was a sharp drop. Fortunately in this case, we knew why. A major project had wrapped and this was an expected fall off of revenue for this account. But seeing it next to the other numbers helps to frame that drop off in a way that is sometimes less effective in casual conversation. That’s the value of doing this on a schedule instead of ad-hoc.
What this doesn’t do
As with every post in this series – there are a few caveats here.
This is a point-in-time snapshot, not a live dashboard. The numbers reflect whatever’s in NetSuite at the moment you run it. If invoices haven’t been entered yet or payments haven’t been applied, the picture is incomplete.
It also doesn’t replace a proper P&L. Invoiced amounts by customer tell you about billing activity, not recognized revenue — especially if your firm uses any kind of deferred revenue or rev rec. For a quick account review it’s the right proxy. For a board presentation it needs more context.
And the whole thing only works if your data is clean. Test records, duplicate customers, unapplied payments — all of it shows up in the numbers and distorts the picture. If you haven’t run a data quality check recently, that’s worth doing first. We wrote about how to do that with AI here.
Why this is worth doing quarterly
The quarterly review problem isn’t a data problem, it’s a friction problem. The data is in NetSuite. Getting it out in a format that’s actually useful for a conversation has always required enough steps that it happens less often than it should — or gets delegated to someone who then has to build the same saved search they built last quarter.
AI connected to NetSuite doesn’t eliminate the judgment calls. It eliminates the setup. You still have to look at the numbers and decide what they mean. But you don’t have to spend 45 minutes building the report before you can do that.
This test allows us to make this a standard part of our account review process. Ten minutes to pull the data, a few minutes to review it, and we go into every client conversation knowing where things stand.
Want to see what this looks like for your account? If you’re running managed services or just want a cleaner picture of your customer revenue health, we’re happy to walk through it. Book a free consultation or reach out and we’ll take a look at what’s possible in your NetSuite environment.
This post is part of our AI + NetSuite series — a hands-on look at what AI can actually do inside a live NetSuite account.